Catch up on previous editions:
July’s Split Screen: Local Sales Jump While Washington Cools
July closings landed with the Chelan County Auditor’s recording backlog fully cleared, making this the first undistorted month of comparisons since April. The outage that understated May and inflated June is behind us. Mortgage rates, meanwhile, have settled into a narrow band near the top of their eleven-month range: Freddie Mac’s 30-year fixed averaged 6.66% in the final week of August, essentially unchanged from 6.65% the week before.
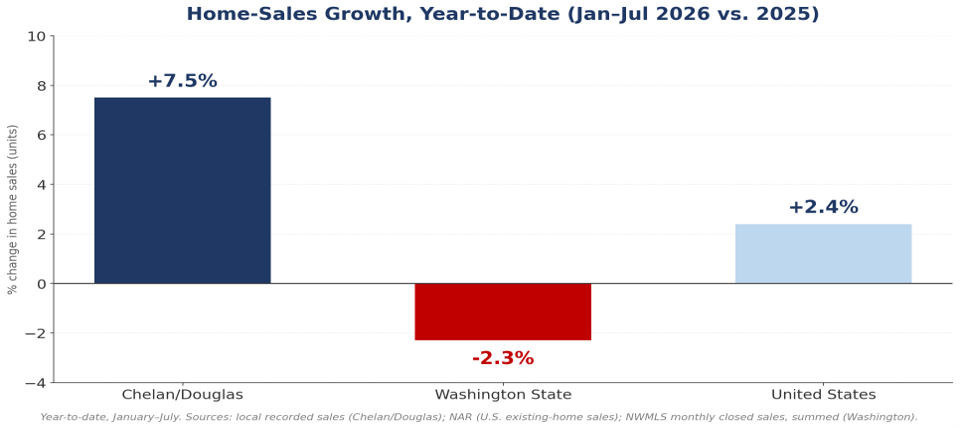
The July numbers describe two different markets. Locally, Chelan and Douglas counties recorded 178 single-family sales, up 22.8% from 145 a year ago, on dollar volume of $118.9 million (+13.4%). Statewide, closed sales fell 3.2% year over year and the median price slipped 1.5% to $640,000, while U.S. existing-home sales rose 0.7%. The year-to-date view tells the same story with less noise: through July, Chelan and Douglas counties are up 7.5% on transactions and 9.5% on dollar volume, against +2.4% nationally and −2.3% for Washington as a whole. North Central Washington is not merely outperforming the state — it is moving in the opposite direction.
Rolling 12-Month SFR Dollar Volume by Region
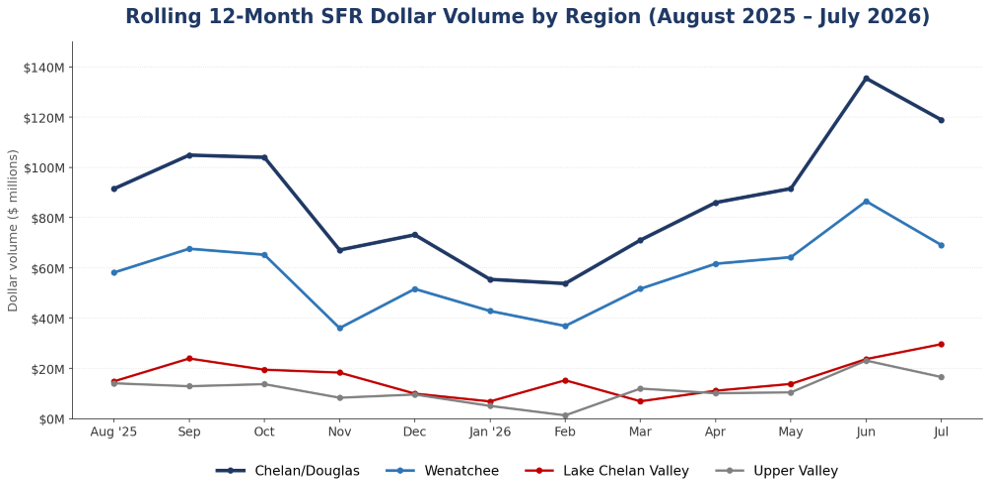
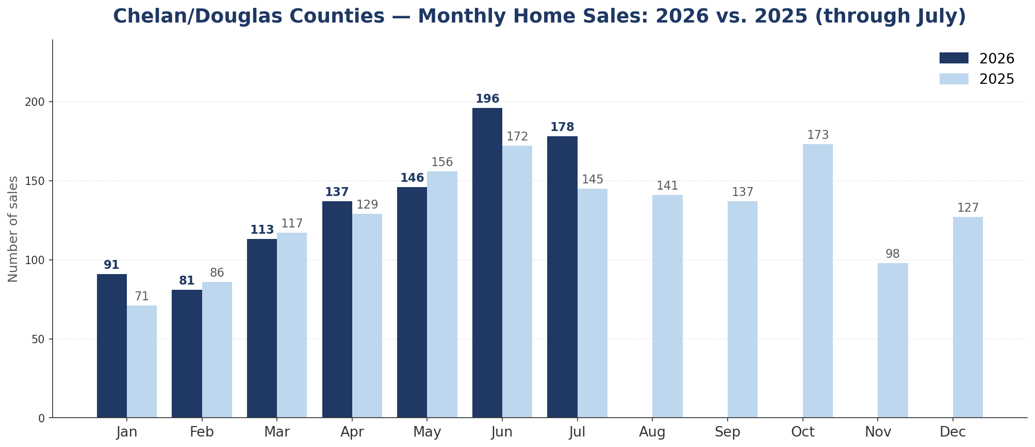
The twelve-month view shows the seasonal cycle running its normal course, with one adjustment. Combined Chelan/Douglas dollar volume peaked at $135.5 million in June and eased to $118.9 million in July. That step down is not a slowdown: June was inflated by May closings that recorded late after the county auditor outage. Measured against July of last year, this month was up 13.4%.
Each sub-market reflects its own conditions. Year-to-date, the Wenatchee market has recorded $412.9 million, the Lake Chelan Valley $107.2 million, and the Upper Valley $78.5 million. Lake Chelan posted its strongest month of the year in July at $29.6 million, while the Upper Valley ran against an unusually strong July 2025.
Chelan/Douglas Counties
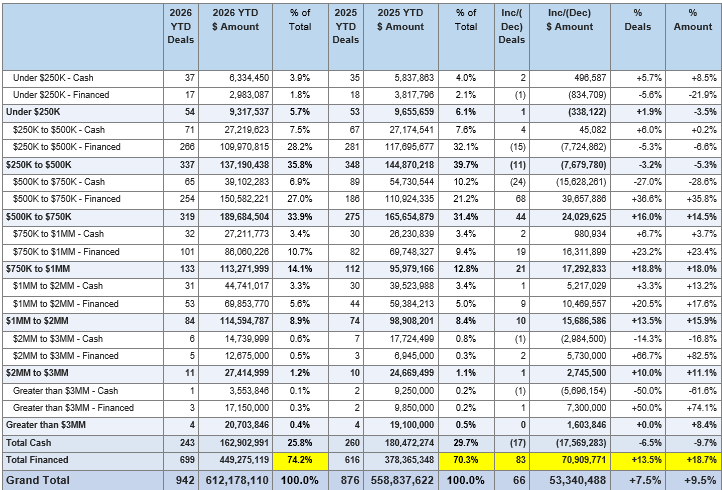
Year-to-date, Chelan and Douglas counties are ahead of last year on both measures: 942 transactions versus 876 (+7.5%) and $612.2 million versus $558.8 million (+9.5%). The dollar-volume lead continues to run ahead of the unit gain, reflecting a richer sales mix across the year as a whole.
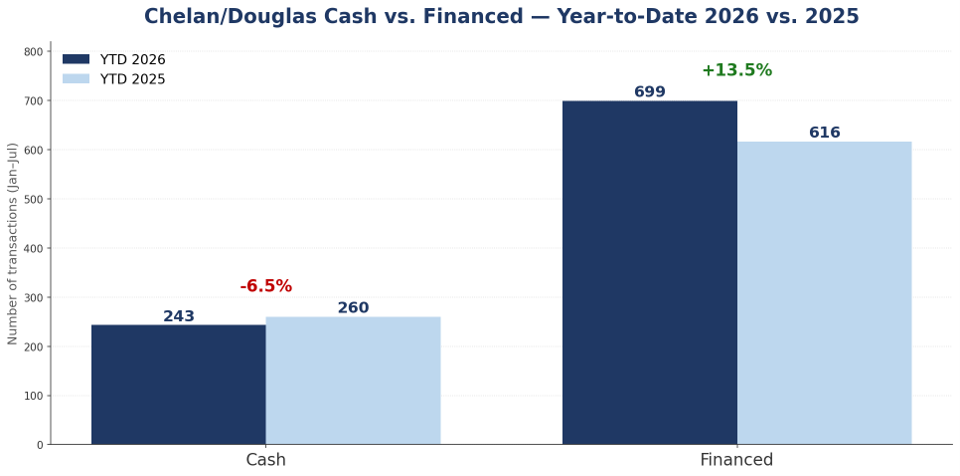
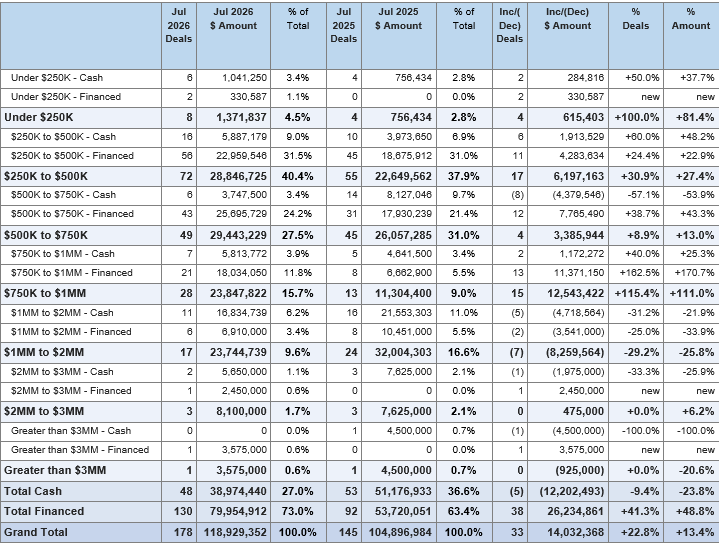
Financed activity remains the engine of the year’s gains. Through July, financed transactions rose to 699 from 616 a year ago (+13.5%), while cash deals eased to 243 from 260 (-6.5%). Financed buyers now account for 74.2% of the market, up from 70.3% a year ago — a meaningful shift in a region that has leaned heavily on cash since interest rates ramped up in 2022. Within July itself the pattern held: 130 of the month’s 178 sales were financed.
Chelan/Douglas July 2026 YTD vs July 2025 YTD
On a single-month basis, July ran well ahead of a year ago — 178 transactions versus 145 (+22.8%) and $118.9 million versus $104.9 million (+13.4%). The unit gain outpaced the dollar gain because the average sale price eased to roughly $668,000 from $723,000 last July, a shift in mix toward the middle of the market rather than a decline in values.
Chelan/Douglas July 2026 vs July 2025
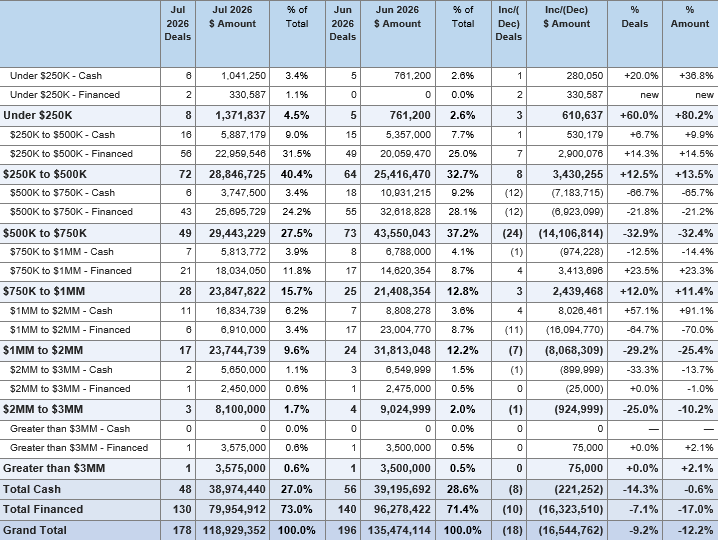
Month over month, July recorded 178 transactions against June’s 196. June’s total was lifted by May closings that recorded late following the county auditor’s malware outage, so the sequential decline overstates any cooling. July’s year-over-year gain is the better measure.
Chelan/Douglas July 2026 vs June 2026
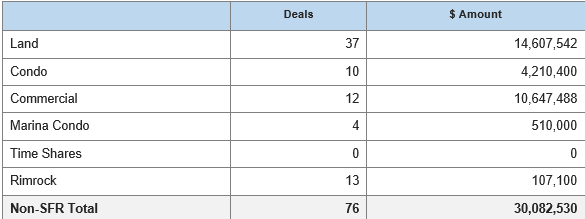
Other Than Single Family Home Sales
In addition to single-family residential, Chelan and Douglas counties recorded the following non-SFR activity in July 2026:
Exploring the Dynamic Wenatchee Market: From Entiat to Malaga, Rock Island to Orondo and West to Cashmere
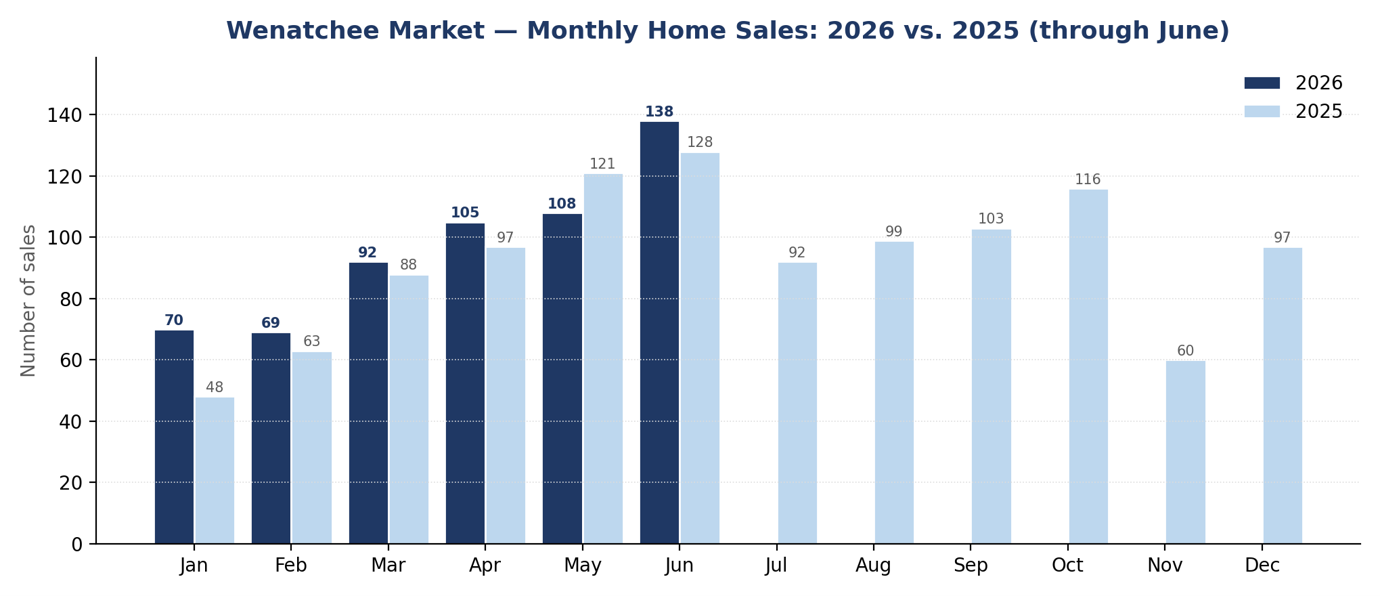
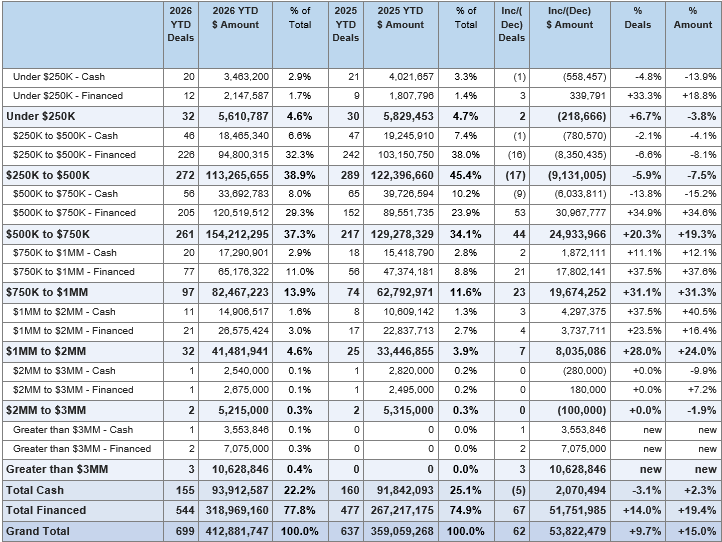
Year-to-date, the Wenatchee market is well ahead of last year: 699 transactions versus 637 (+9.7%) and $412.9 million versus $359.1 million (+15.0%). Dollar volume is growing half again as fast as unit count — the widest gap of any local sub-market.
Wenatchee July 2026 YTD vs July 2025 YTD
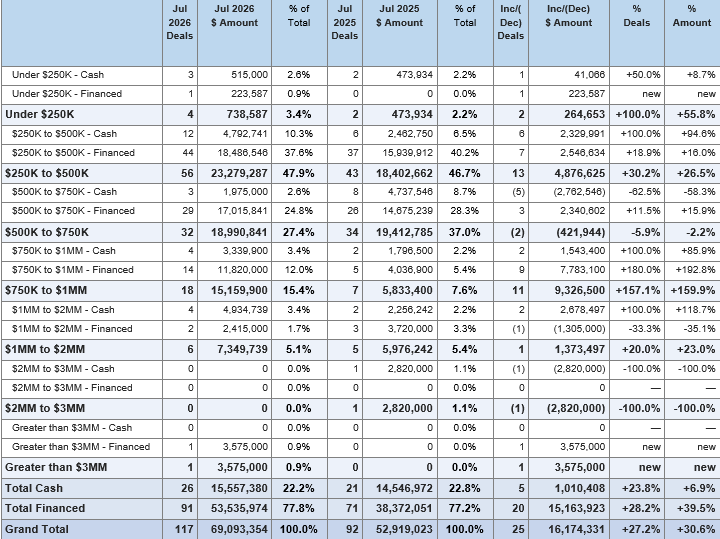
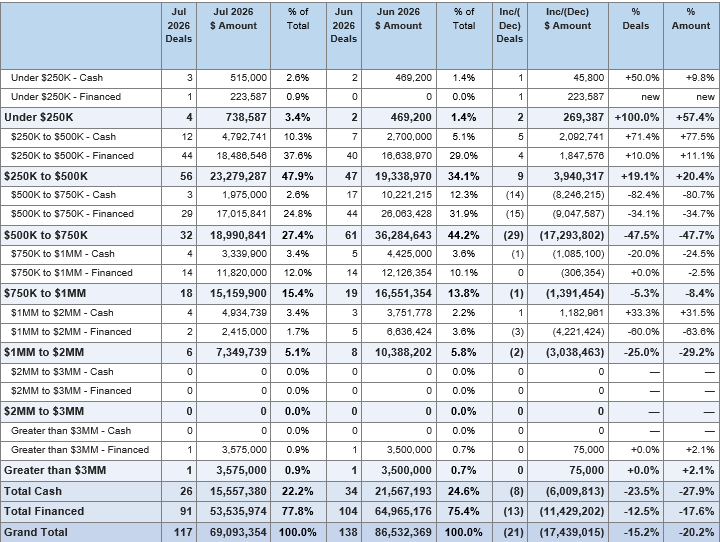
July single-month sales were up 27.2% year over year (117 versus 92) and dollar volume rose 30.6% ($69.09 million versus $52.92 million). Financed buyers accounted for 91 of the month’s 117 transactions.
Wenatchee July 2026 vs July 2025
Month over month, the count eased from 138 in June to 117 in July. June carried the last of the delayed recordings, so July is the better read on the market’s underlying pace.
Wenatchee July 2026 vs June 2026
The Chelan Market: Encompassing Manson and Stehekin
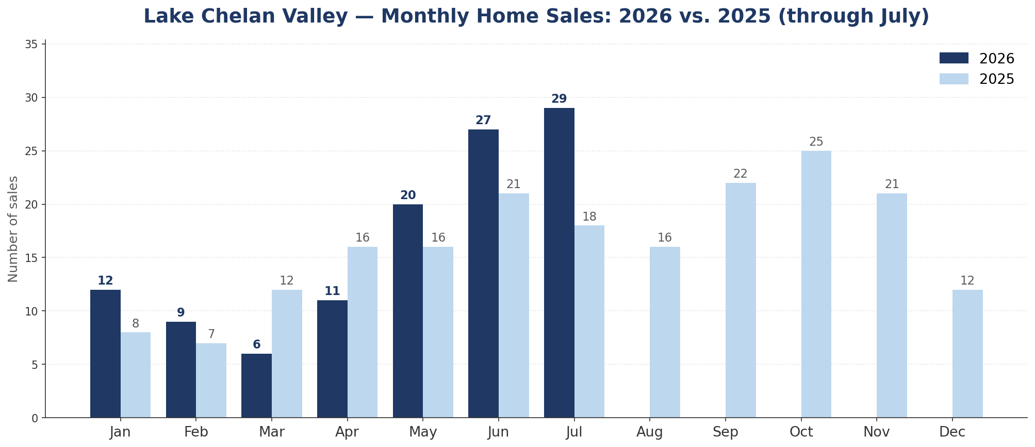
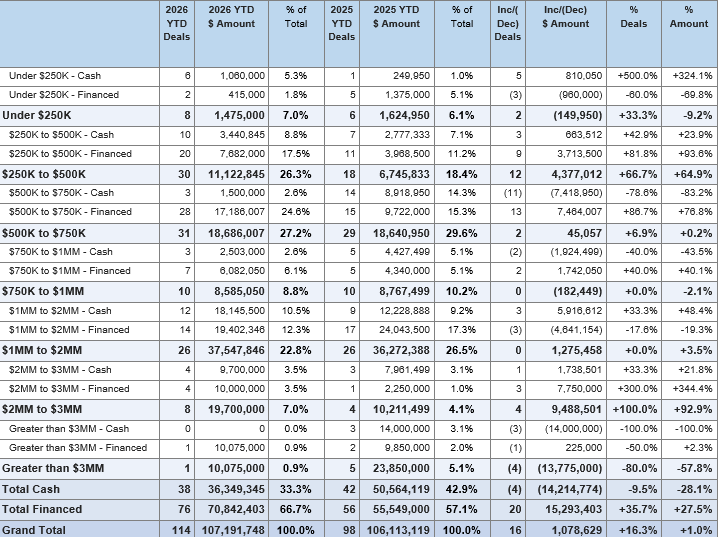
Year-to-date through July, the Lake Chelan Valley is ahead on transaction count — 114 versus 98 (+16.3%) — while dollar volume is essentially flat at $107.2 million against $106.1 million (+1.0%). With the Valley’s smaller volumes, a handful of high-end transactions swings the dollar figures sharply, and last year’s first half carried more of them.
Lake Chelan Valley July 2026 YTD vs July 2025 YTD
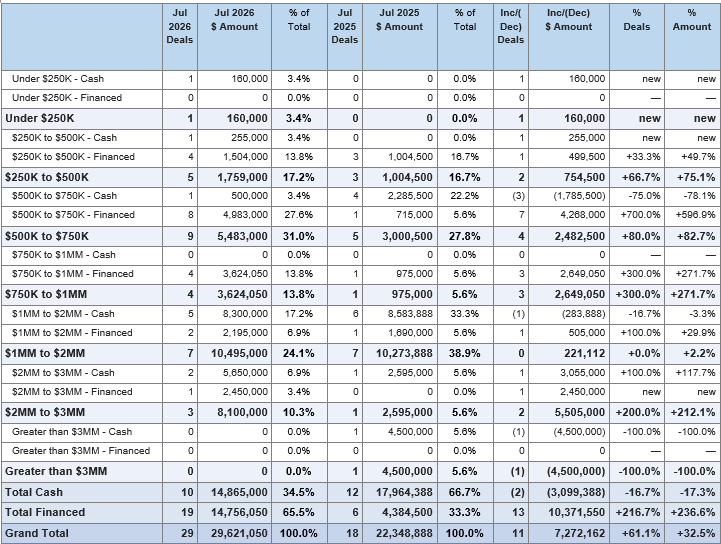
July was the Valley’s strongest month of the year: 29 sales versus 18 a year ago (+61.1%) and $29.6 million versus $22.3 million (+32.5%). Cash accounted for $14.9 million of the month’s volume, almost exactly half.
Lake Chelan Valley July 2026 vs July 2025
Exploring the Upper Valley Market: Insights from Dryden to Stevens Pass, Including Leavenworth, Lake Wenatchee and Plain
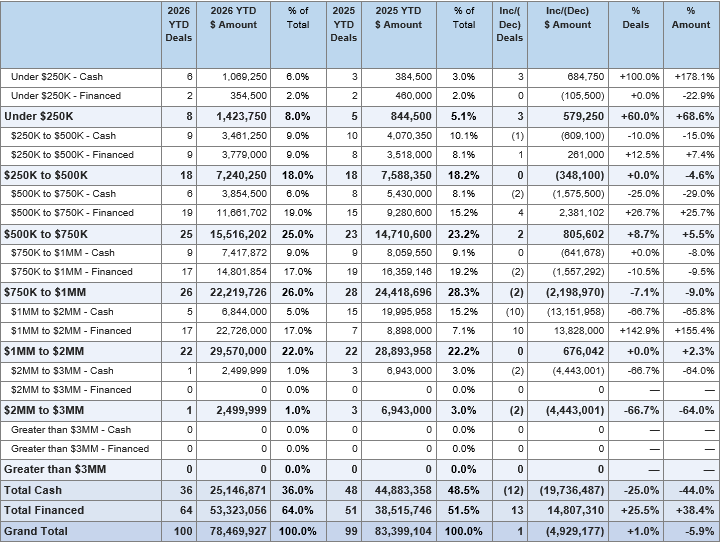
Year-to-date, the Upper Valley is holding roughly even with last year: 100 transactions versus 99 (+1.0%), with dollar volume at $78.5 million against $83.4 million (-5.9%).
Year-to-date parity is itself the story for the Upper Valley after a first quarter that ran far behind. July’s comparison is unflattering for a specific reason: July 2025 was the corridor’s single strongest month of that year, at 29 sales and $27.8 million.
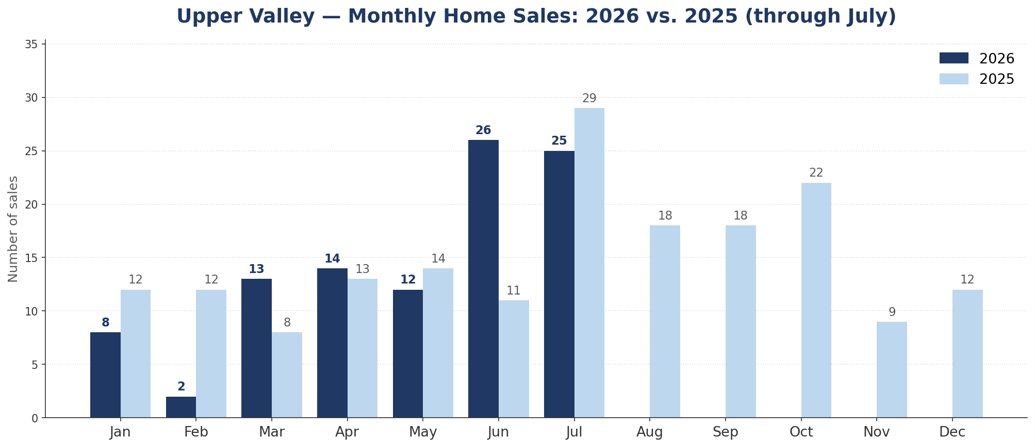
Upper Valley July 2026 YTD vs July 2025 YTD
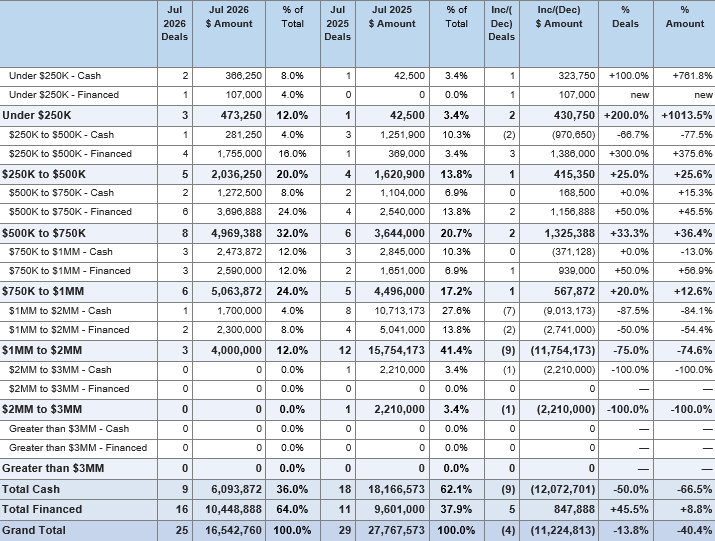
On a single-month basis, July recorded 25 transactions versus 29 a year ago, and $16.5 million versus $27.8 million. Against June 2026’s 26 sales the corridor held steady; against an exceptional July 2025 it did not.
Upper Valley July 2026 vs July 2025