Catch up on previous editions:
More Sales, Smaller Sales — and a Decisive Shift to Financing
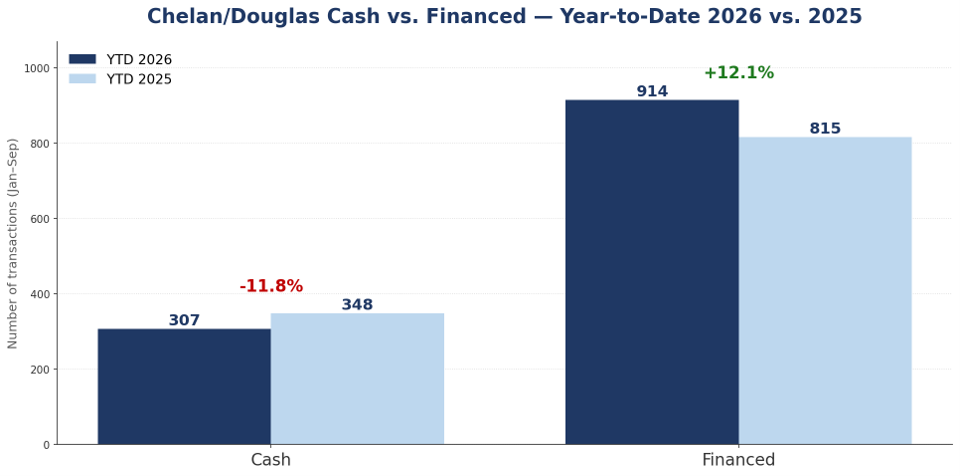
Last month we said sales were sliding. In September they kept sliding, but not in the way that phrase suggests. Unit count actually rose — 143 transactions against August’s 136, the first monthly increase since June — while dollar volume fell again, from $92.9 million to $84.3 million. More homes changed hands, for less money: the average sale price dropped to roughly $589,000, from $683,000 in August and $718,000 in September of last year. The financing mix has shifted decisively as well. Year-to-date, financed transactions are up 99, or 12.1%, while cash deals have fallen by 41; financed buyers now account for 74.9% of the two-county market against 70.1% a year ago, and in the Wenatchee market the shift is sharper still, at 82.5% of September’s sales versus 70% a year ago. Rates remain the backdrop: Freddie Mac’s 30-year fixed stood at 7.24% on October 29, easing from 7.32% the week before but well above the 6.17% of a year ago. Year-to-date, Chelan and Douglas counties still run ahead of 2025 on both transactions and dollar volume — but that lead is only 58 transactions, and October 2025 was last year’s strongest month, at 173 sales. Pacific Appraisal’s October report already shows Wenatchee-area closings down 22% from a year ago, with active listings up 32% — a direct reflection of higher borrowing costs. On those numbers we expect the year-to-date comparison to be close to level once October is counted.
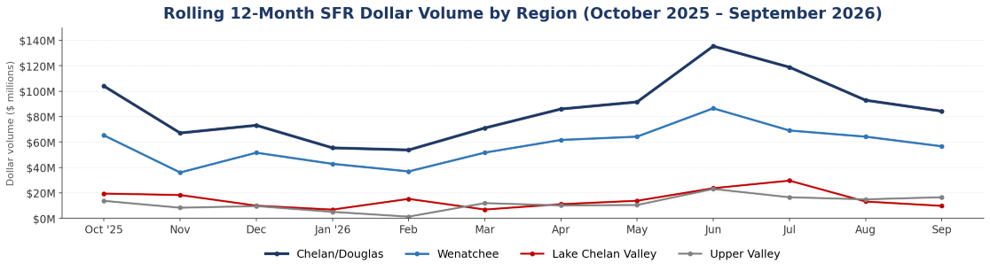
Rolling 12-Month SFR Dollar Volume by Region
The chart below tracks rolling twelve-month dollar volume for each of the four local markets. The combined Chelan/Douglas line sets the overall shape, with the Wenatchee market running beneath it and accounting for most of the total; the Lake Chelan Valley and the Upper Valley sit closer together along the bottom, where smaller volumes make their lines swing more sharply. September was the third consecutive monthly decline for the two counties, carrying dollar volume from a June peak of $135.5 million down to $84.3 million — the lowest monthly total since March.
Chelan/Douglas Counties
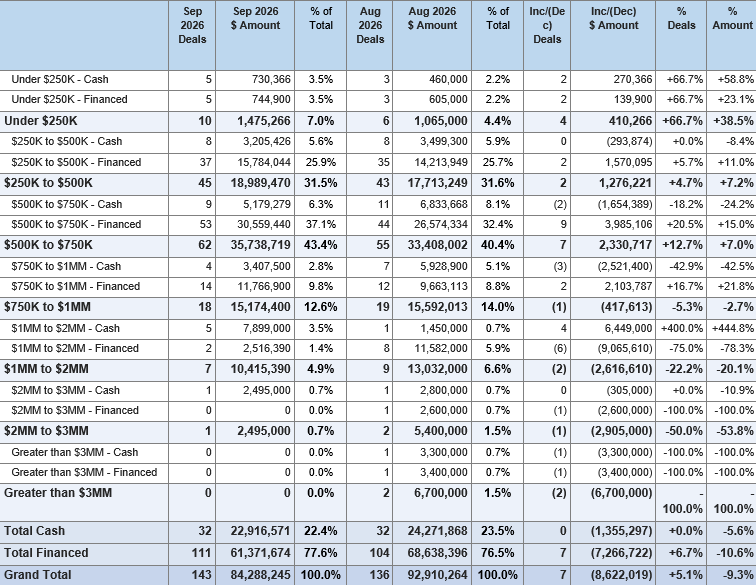
Month over month, September recorded 143 transactions against August’s 136 — the first monthly increase since June — while dollar volume fell from $92.9 million to $84.3 million. The two measures moved in opposite directions because the average sale price dropped to roughly $589,000 from $683,000. Activity grew at the lower end of the market and thinned at the top.
Chelan/Douglas September 2026 vs August 2026
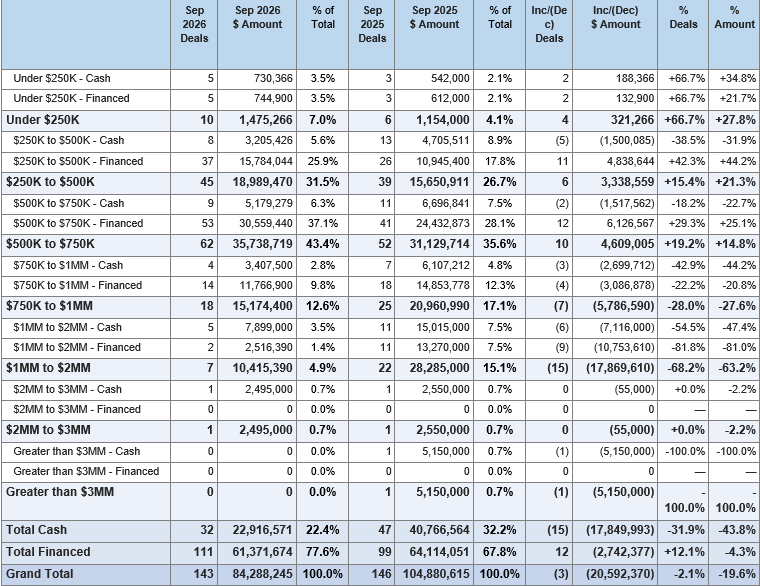
Measured against the same month last year, September was down on both counts: 143 transactions versus 146 (-2.1%) and $84.3 million versus $104.9 million (-19.6%). The dollar gap is the widest of the year, and it is largely a question of price mix. Sales under $750,000 rose from 97 a year ago to 117, while sales above $750,000 fell from 49 to 26 — close to half.
Chelan/Douglas September 2026 vs September 2025
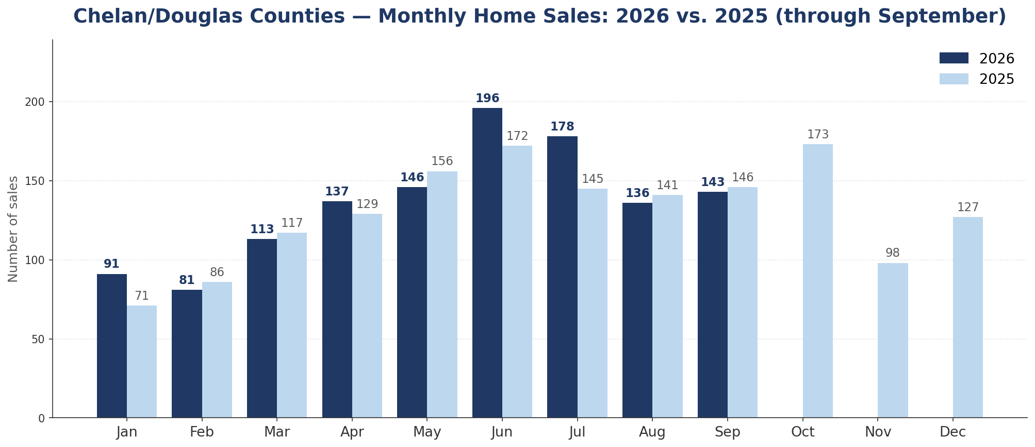
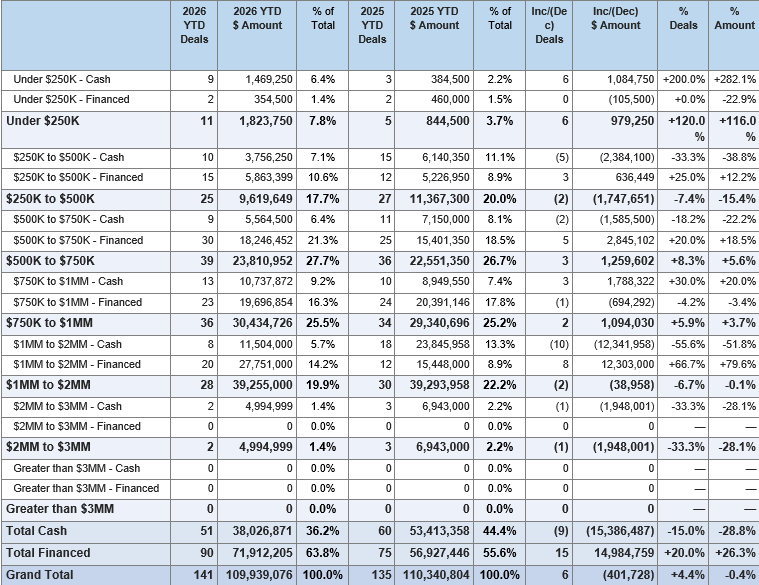
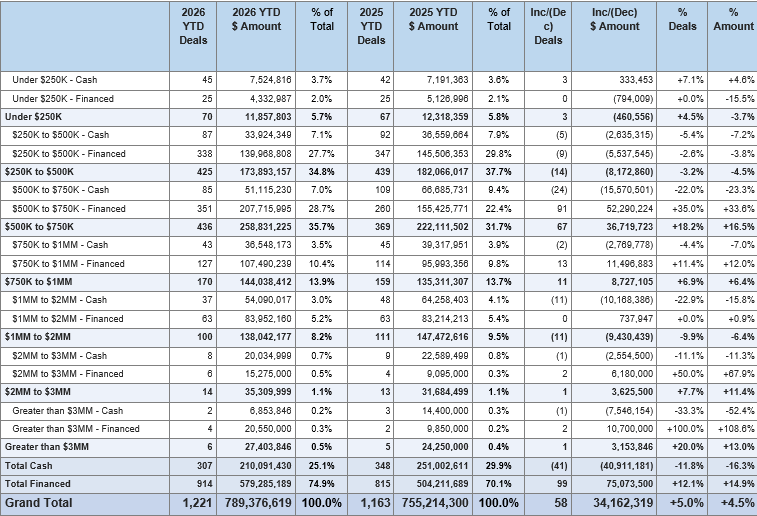
Taking the year as a whole, Chelan and Douglas counties remain ahead on both measures: 1,221 transactions versus 1,163 (+5.0%) and $789.4 million versus $755.2 million (+4.5%). The margin is narrowing — through August the dollar lead stood at 8.4% — and three declining months have not yet erased the first-half advantage, though early indications are that October was a very weak month.
Chelan/Douglas September 2026 YTD vs September 2025 YTD
Financed activity remains the engine of the year’s gains. Through September, financed transactions rose to 914 from 815 a year ago (+12.1%), while cash deals eased to 307 from 348 (-11.8%). Financed buyers now account for 74.9% of the market, up from 70.1% a year ago — a meaningful shift in a region that has leaned heavily on cash since interest rates ramped up in 2022. September ran higher still: 111 of the month’s 143 sales were financed, or 77.6%.
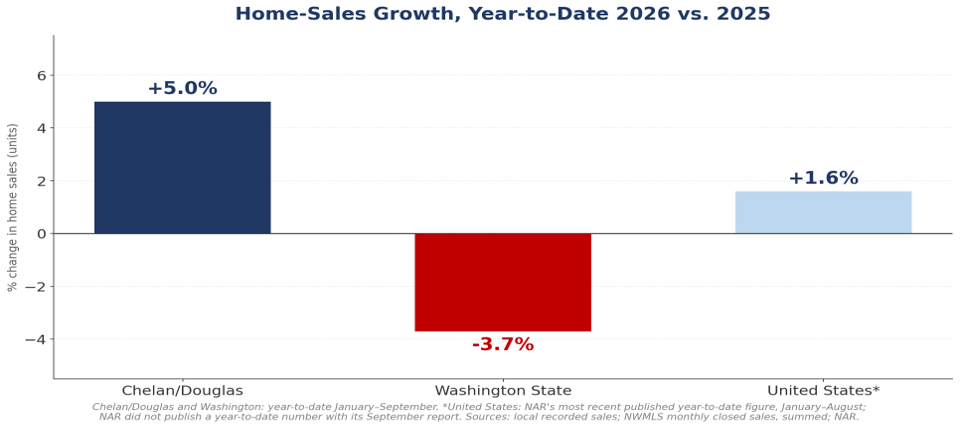
Set against the wider market, that year-to-date position still stands out. Across Washington, closed sales are down about 3.7% year-to-date, and September alone fell 8.9% — the slowest September in the NWMLS service area since at least 2014. Nationally, the most recent year-to-date figure NAR published was a 1.6% gain through August; it did not publish one alongside its September report, which showed sales 2.2% below a year earlier. Statewide inventory is up 24.5%, and months of supply have reached 4.44, the highest since February 2014.
Other Than Single Family Home Sales
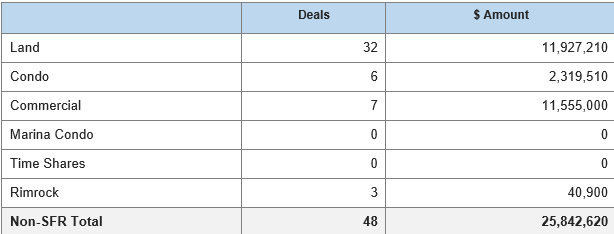
In addition to single-family residential, Chelan and Douglas counties recorded the following non-SFR activity in September 2026:
Exploring the Dynamic Wenatchee Market: From Entiat to Malaga, Rock Island to Orondo and West to Cashmere
Month over month, the Wenatchee count held essentially flat — 103 sales in September against 102 in August — while dollar volume fell from $64.23 million to $56.65 million. The same pattern as the two-county market: a steady transaction count carrying lighter dollars, with financed transactions jumping to 82.5% of the total
Wenatchee September 2026 vs August 2026
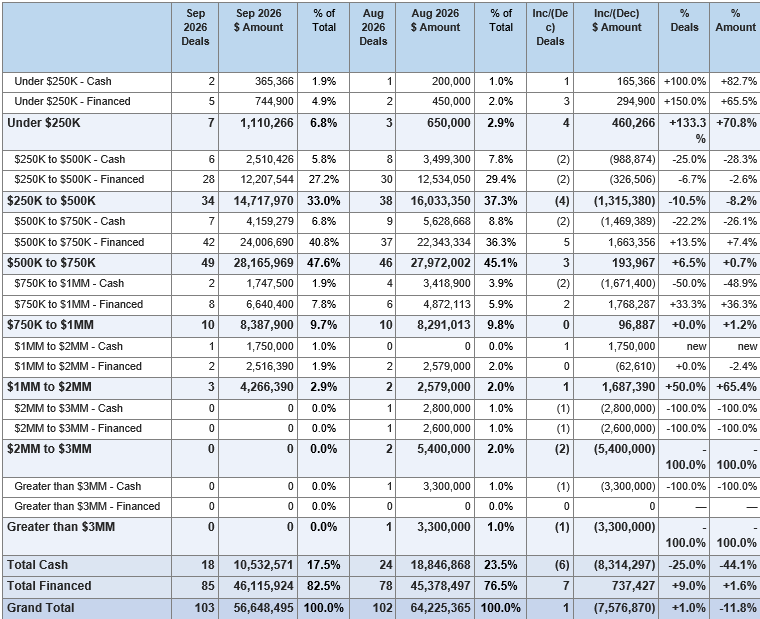
Month over month, the Wenatchee count held essentially flat — 103 sales in September against 102 in August — while dollar volume fell from $64.23 million to $56.65 million. The same pattern as the two-county market: a steady transaction count carrying lighter dollars, with financed transactions jumping to 82.5% of the total.
Wenatchee September 2026 vs September 2025
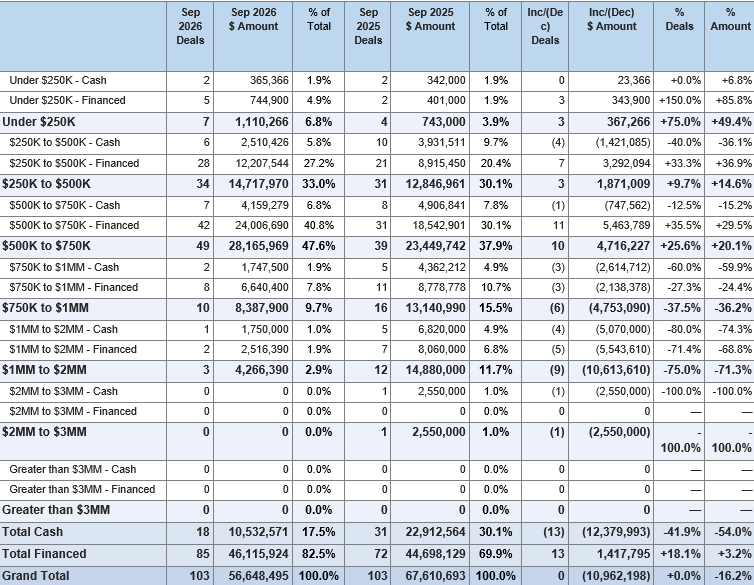
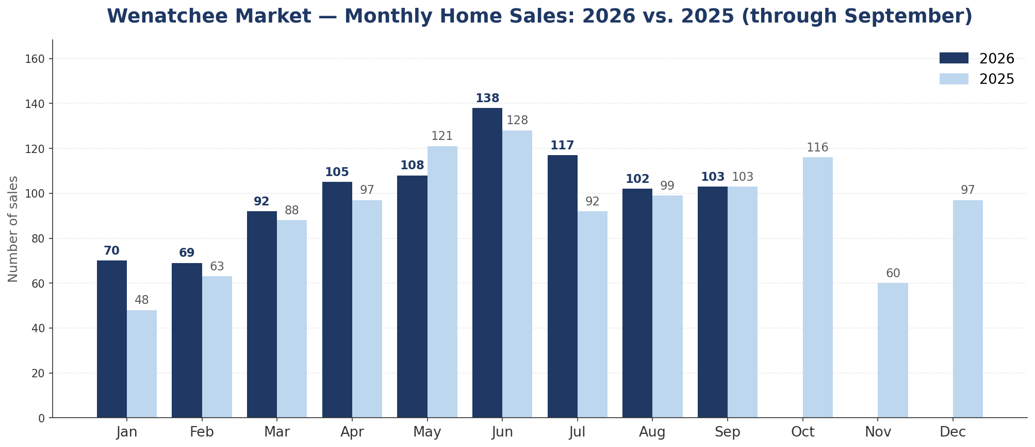
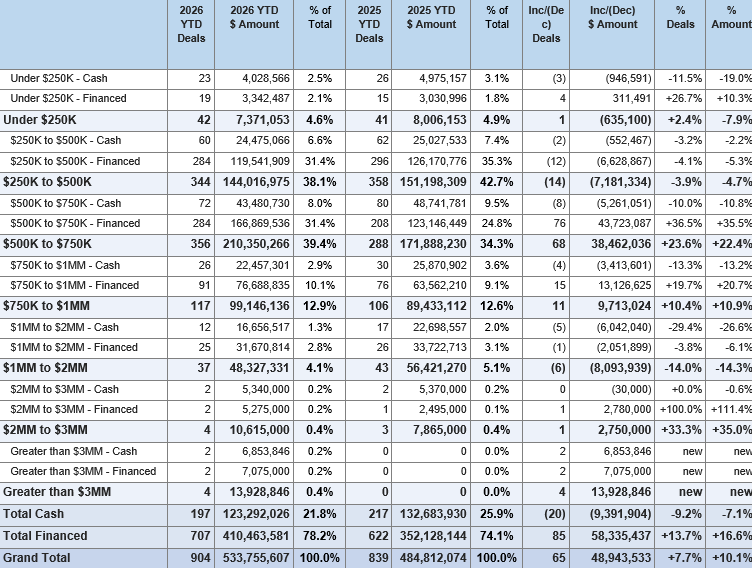
Year-to-date, the Wenatchee market is well ahead of last year: 904 transactions versus 839 (+7.7%) and $533.8 million versus $484.8 million (+10.1%). It remains the strongest of the local sub-markets on both measures.
Wenatchee September 2026 YTD vs September 2025 YTD
The Chelan Market: Encompassing Manson and Stehekin
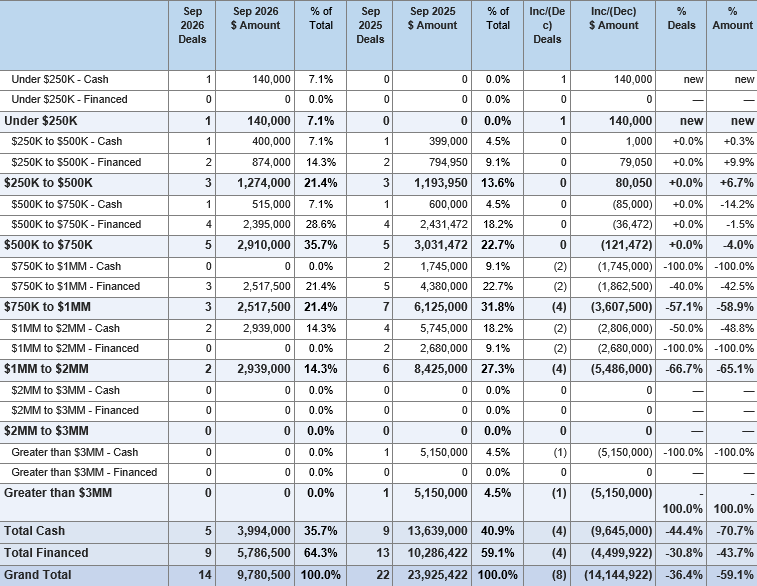
September was a difficult month in the Valley: 14 sales versus 22 a year ago (-36.4%) and $9.78 million versus $23.93 million (-59.1%).
Lake Chelan Valley September 2026 vs September 2025
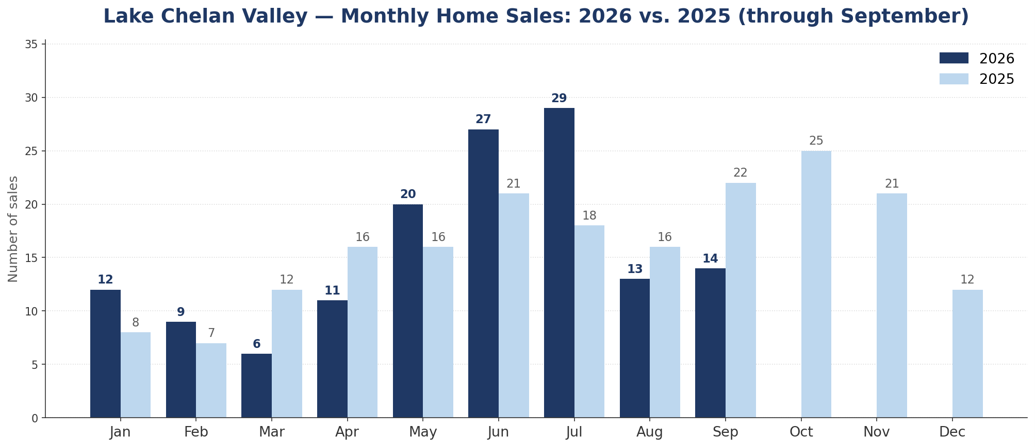
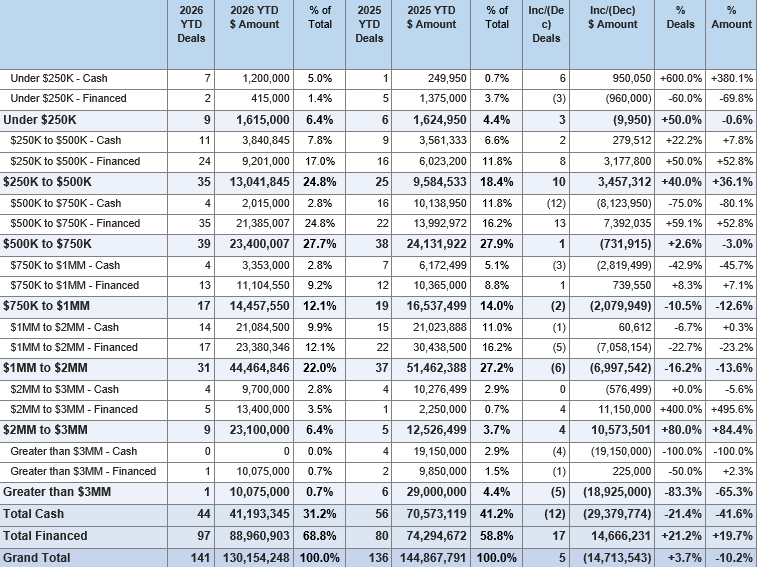
Year-to-date through September, the Lake Chelan Valley is still ahead on transaction count — 141 versus 136 (+3.7%) — while dollar volume trails at $130.2 million against $144.9 million (-10.2%). With the Valley’s smaller volumes, a handful of high-end transactions swings the dollar figures sharply, and last year carried more of them.
Lake Chelan Valley September 2026 YTD vs September 2025 YTD
Exploring the Upper Valley Market: Insights from Dryden to Stevens Pass, Including Leavenworth, Lake Wenatchee and Plain
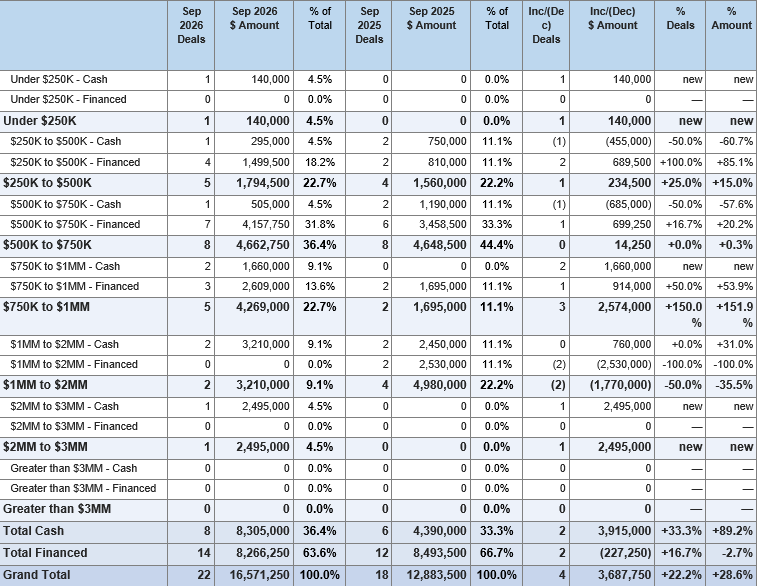
The Upper Valley was the month’s bright spot: 22 transactions versus 18 a year ago (+22.2%) and $16.57 million versus $12.88 million (+28.6%) — the only local sub-market to post an increase in either column this month.
Upper Valley September 2026 vs September 2025
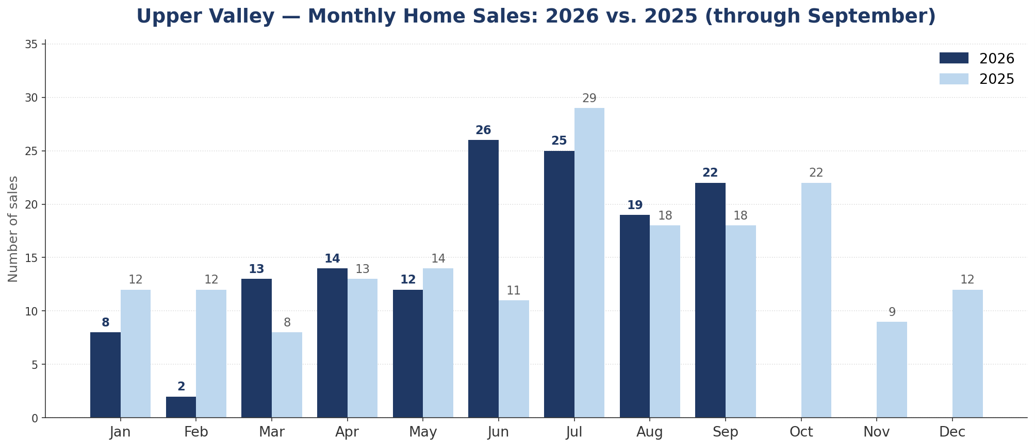
Year-to-date, the Upper Valley is ahead on count — 141 transactions versus 135 (+4.4%) — with dollar volume essentially level at $109.9 million against $110.3 million (-0.4%).
After a very weak first quarter the corridor has closed its gap steadily, and September brings dollar volume back to within half a percentage point of last year’s pace.
Upper Valley September 2026 YTD vs September 2025 YTD